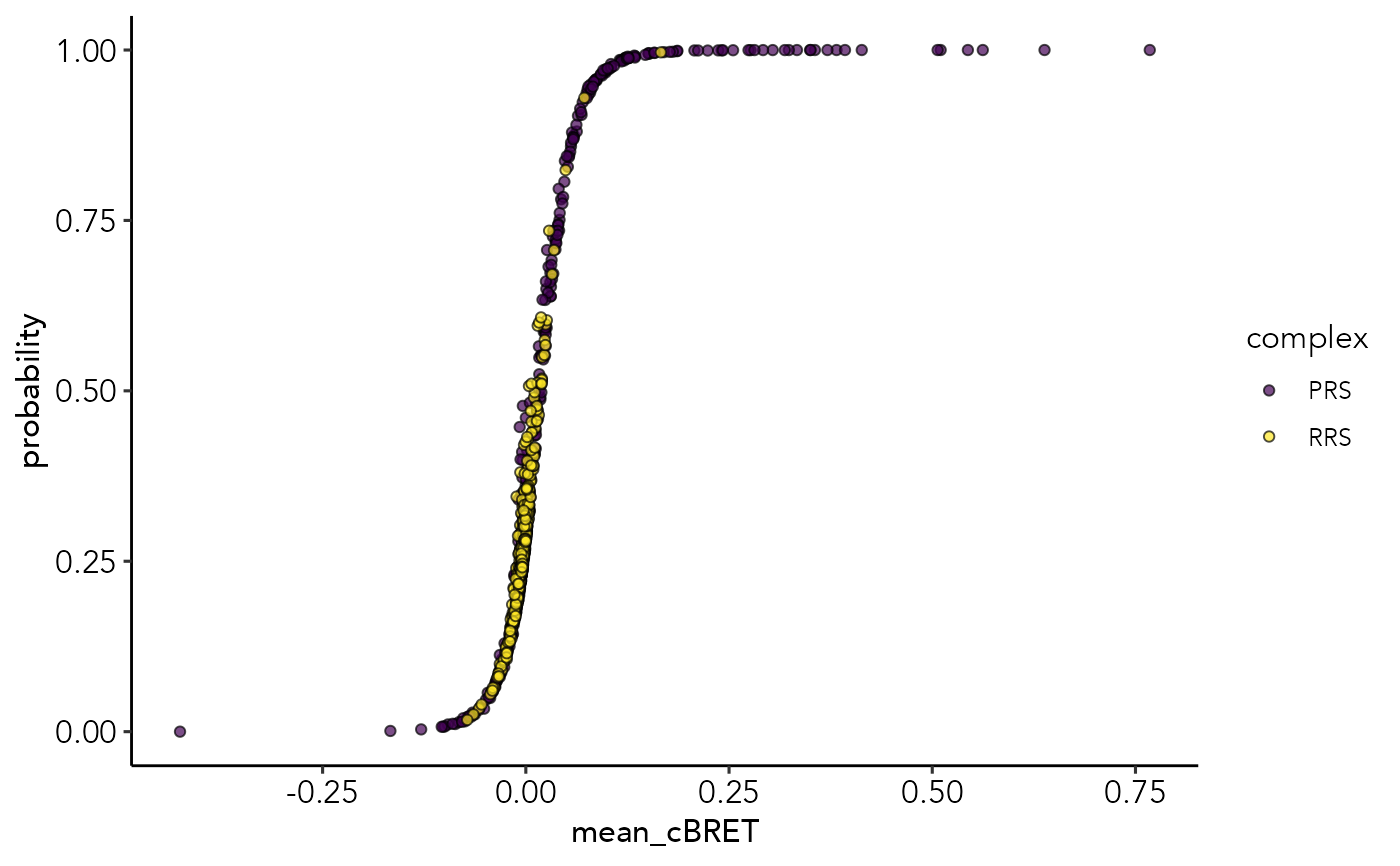
Plot a scatter plot of the probability distribution against the primary assay feature
probDis.plot.RdPlot a scatter plot of the probability distribution against the primary assay feature
probDis.plot(ppi_prediction_result, set = "test", assay = "mean_cBRET")Arguments
- ppi_prediction_result:
result object from the ppi.prediction() function.
- set:
PPI set to generate the plot for: "test" or "train"
- assay:
specify which training feature to plot against the probability
Value
a ggplot2 object
Examples
data("example_ppi_prediction")
probDis.plot(example_ppi_prediction)
#> Warning: Removed 91 rows containing missing values (geom_point).